Introduction
Businesses are always on the lookout for ways to optimize processes and gain greater visualization. When processes work efficiently, the output of the product is higher. This leads to workflows that run smoothly with minimum errors and higher capacity. A good reason for the growing popularity of process automation and visualization. Automation and visualization are the future of the business strategy. Gone are the days of carefully filling in graph paper by hand. Today, process automation and visualization help enterprises up their game by allowing access to real-time models capable of accurately capturing the nuanced data sets. In this blog, we will expand on how enterprises can up their game with process automation and visualization.
Understanding Process Automation & Benefits

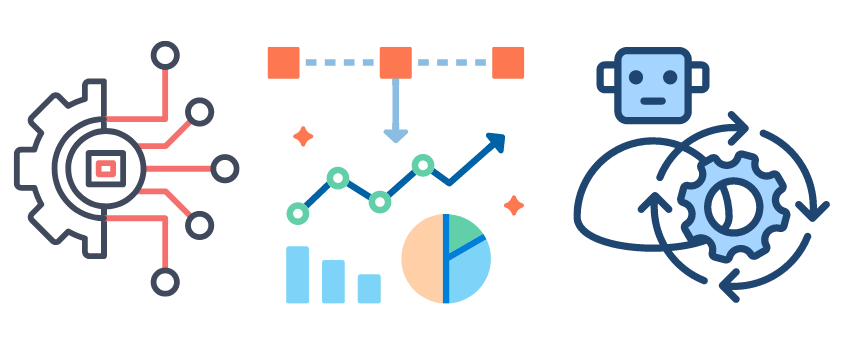
Process automation involves the use of technology to automate routine and repetitive tasks, reducing manual intervention and minimizing errors. The primary goals include increasing efficiency, reducing operational costs, and enhancing accuracy. Common automation technologies encompass robotic process automation (RPA), artificial intelligence (AI), and machine learning (ML). Benefits of Process Automation: 1. Efficiency Gains: Automation eliminates time-consuming manual tasks, enabling employees to focus on more strategic and complex responsibilities. 2. Error Reduction: Automated processes minimize human errors, leading to increased accuracy and consistency in operations. 3. Cost Savings: By automating routine tasks, organizations can achieve significant cost savings through reduced labor expenses and improved resource allocation. 4. Enhanced Scalability: Automated processes are inherently scalable, adapting seamlessly to changes in workload and business demands.
What is Visualization in Business
Visualization refers to the graphical representation of data and processes to facilitate better understanding, analysis, and decision-making. In the context of business operations, visualization tools translate complex datasets into comprehensible visuals, providing stakeholders with actionable insights.
The Synergy of Process Automation and Visualization

1. Data-Driven Decision Making: Automation generates vast amounts of data. Visualization tools help distill this data into meaningful insights, empowering decision-makers to make informed choices based on real-time information. 2. Performance Monitoring: Visualization dashboards enable real-time monitoring of automated processes, allowing organizations to identify bottlenecks, inefficiencies, or potential issues promptly. 3. Enhanced Communication: Visualization simplifies complex concepts, making it easier for stakeholders across different departments to understand and collaborate effectively on automated processes.
Selecting the Right Tools
1. Process Automation Tools: Evaluate and choose automation tools based on the specific needs and nature of your business processes. Consider factors such as scalability, integration capabilities, and adaptability. 2. Visualization Platforms: Explore visualization tools that align with your organization's goals. Look for platforms that offer customizable dashboards, real-time reporting, and user-friendly interfaces.
Conclusion
The convergence of process automation and visualization represents a powerful strategy for organizations seeking to optimize their operations. By harnessing the synergy between these two technologies, businesses can unlock unprecedented efficiency gains, make data-driven decisions, and position themselves for sustained success in an increasingly competitive landscape.


